Uses cases
Metabase is an effective solution for a wide range of analytical needs in both technical and non-technical teams. It excels in scenarios such as:- Empowering business users who need to ask questions and explore data without writing SQL
- Providing quick, ad-hoc insights, such as checking recent signups, sales trends, or operational metrics
- Creating lightweight dashboards that support interactive filtering, drill-downs, and simple visual exploration
- Operating within secure enterprise environments, where features like Security Assertion Markup Language (SAML), Single Sign-On (SSO), JSON Web Token (JWT) authentication, HTTPS ingress, and embedded analytics are crucial
Metabase and Trino
Trino is a distributed SQL query engine that lets Metabase query multiple data sources such as databases or Iceberg tables, through a single connection.Automatic configuration
Within NexusOne, the Trino connection is already preconfigured in Metabase. That means the host, port, catalog, or credentials are available before the app starts. With all these already configured, you can start exploring data immediately.How Metabase periodically updates its content from Trino
Some queries might be expensive, so Metabase takes extra measures to sync with Trino-connected catalogs. This reduces load on Trino and improves Metabase’s responsiveness. These measures include:- Metadata refresh: Metabase updates its internal metadata cache so it knows about the latest table and column definitions of the Trino-connected data sources.
- Field value cache: Metabase stores the distinct values of a field that appear in dropdown filters to speed up the UI.
- Hourly metadata sync
- Daily field value cache refresh
Exploring the Metabase UI
The Metabase homepage is your starting point for navigating data, creating content, and reopening recent work. This section explores the Metabase UI and how to navigate it. Before exploring these, you can launch Metabase using the following designated URL:When you purchase NexusOne, you receive a client name.
Replace
client with your assigned client name.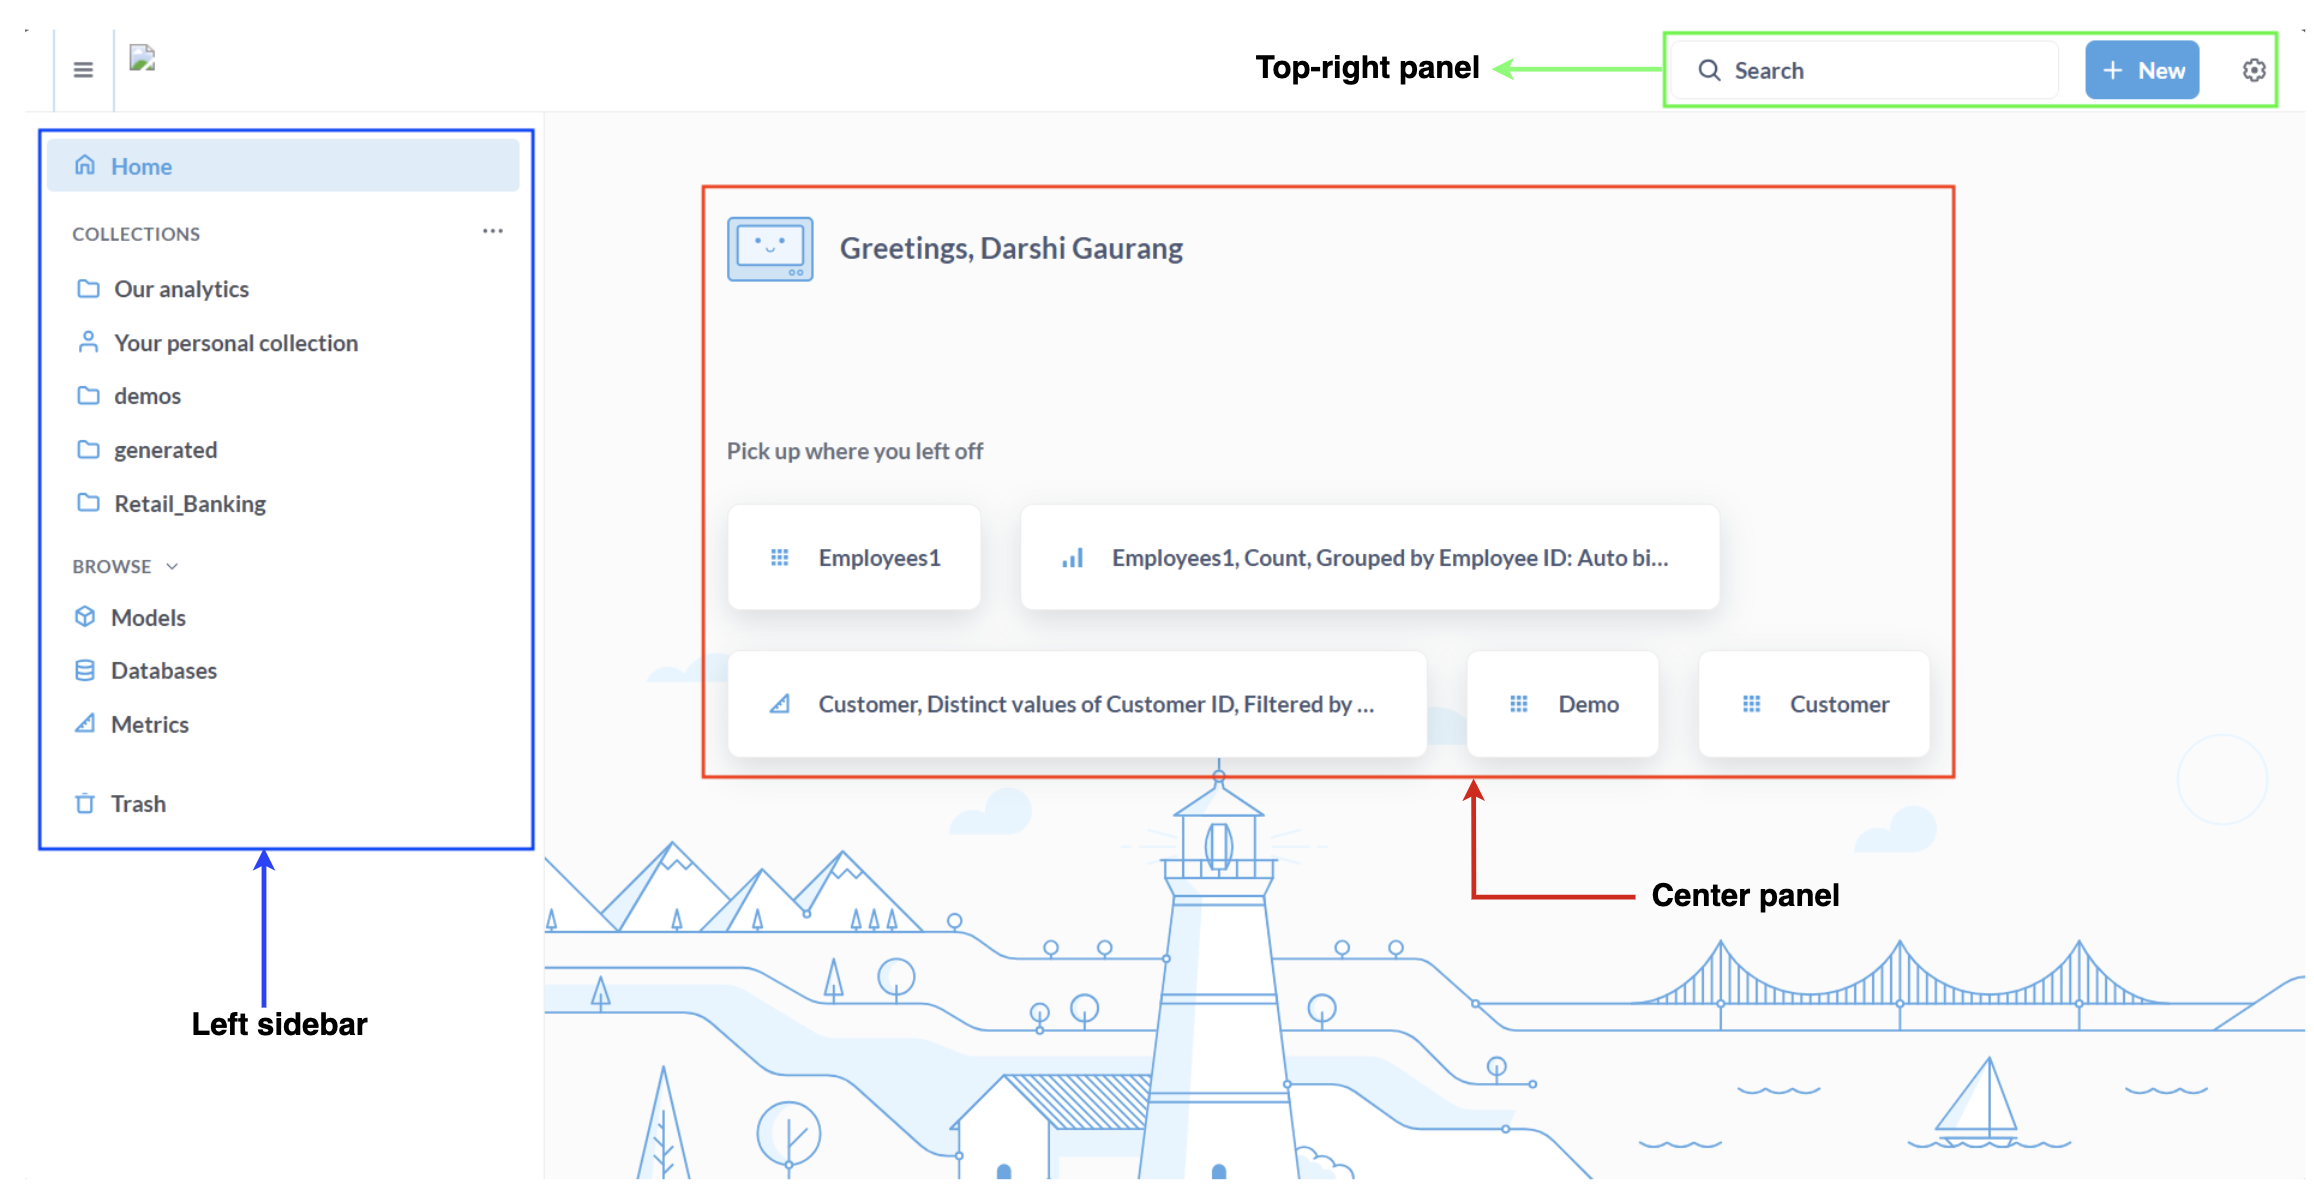
Metabase homepage
Left sidebar
As seen in the previous image, the left sidebar provides quick access to core areas of Metabase. It organizes your workflow so you can move between dashboards, databases, and other resources efficiently. It comprises the following:Home: Returns to the main screenCollections: Folders containing dashboards, questions, and modelsBrowse:Models: Contains reusable virtual tablesDatabases: Browse connected databases and tablesMetrics: Centrally defined business metrics
Trash: Recover deleted items
Center panel
As seen in the previous image, the center panel displays the following:- A greeting message
- The
Pick up where you left offsection lists your most recent questions, tables, or dashboards so you can quickly continue working.
Top-right panel
As seen in the previous image, the top-right panel displays the following:Search: Find questions, dashboards, tables, or collections.New: When you click New, it displays the following options in the dropdown:Question: Create a new query using the visual builder or custom expressions.SQL Query: Write a custom SQL statement to build a question or model.Dashboard: Combine multiple questions into one interactive view.Collection: Create a folder to organize dashboards, questions, and models.Model: Build a reusable, cleaned-up virtual table for analysis.Metric: Define a standardized business metric for consistent reporting.
Metabase query methods
In Metabase, you can use either the query builder or SQL editor to query data through Trino. This depends on your user role and expertise.GUI query builder
The query builder is a visual interface that allows non-technical users to create questions and dashboards without writing SQL. It supports the following features:- Click-based filters: Refine data directly in your questions or dashboard widgets.
- Aggregations and summaries: Summarize and aggregate your data, such as sums, averages, or counts.
- Grouping and breakdowns: Group data by categories to better understand trends.
- Easy visualization selection: Choose the best way to visualize your data using graphs or bar charts.
- Data exploration without writing SQL: Create both questions and widgets, then add them to dashboards for easy exploration.
SQL editor
For data analysts, engineers, and power users working with complex datasets or performing advanced analytics, the SQL editor exposes the full capabilities of Trino. Through this interface, you can do the following:- Write raw SQL queries
- Use parameters inside SQL statements
- Save reusable queries or native questions
- Join across datasets and catalogs
Metabase hands-on examples
This section describes several hands-on examples of using Metabase.Select a schema and table
Metabase displays the schemas and tables exposed by Trino. A typical tree structure of Metabase and its connected catalog, schemas, and tables looks like the following:- From the Metabase homepage, click Databases in the Browse section on the left panel.
- Select a desired database.
- Select a desired schema.
- Select a desired table to inspect its content.
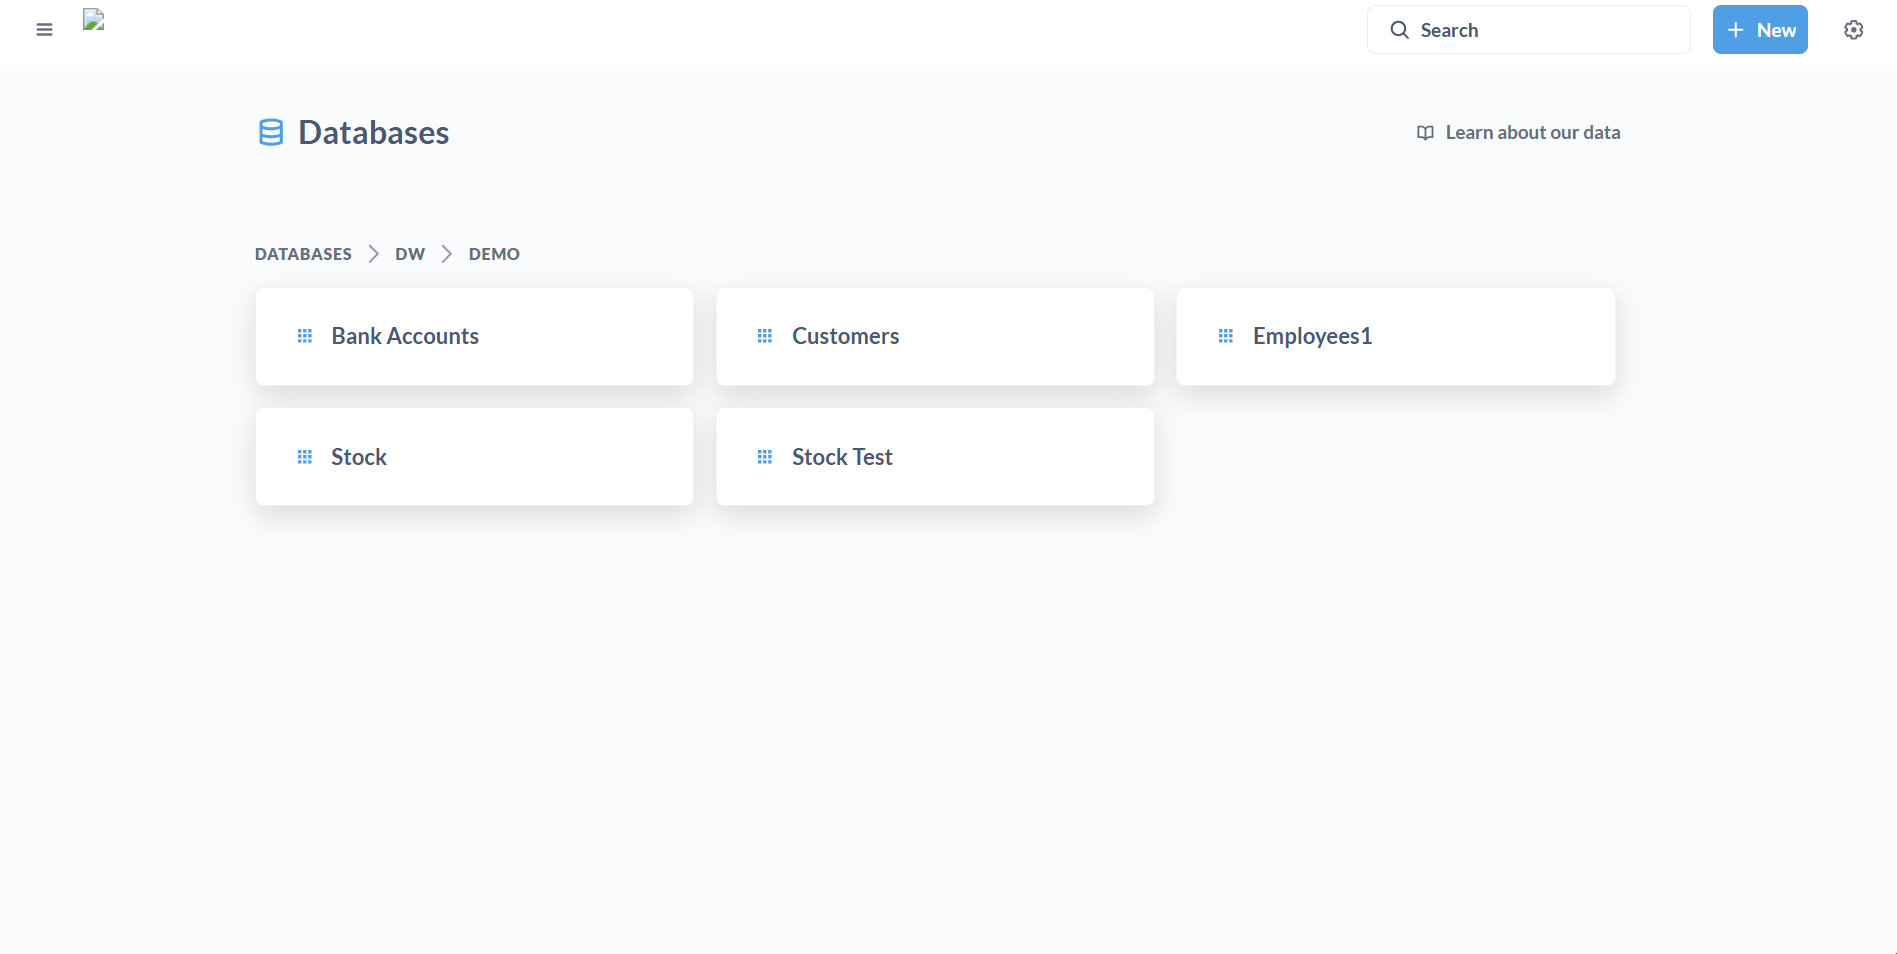
Tables inside a schema
Create a question
A question in Metabase is a saved query or visualization that extracts and displays data from your databases. You can create a question from a model, table, or previous questions. Follow these steps to create a question from a table:- From the Metabase homepage, click New > Question.
- Click Tables to choose the data you want to work with.
- Select a schema and table.
- Optional: Add filters to refine your data.
- Optional: Summarize the data by applying aggregations or groupings,
- Click Save at the top right corner of the page.
- In the Name field, enter a name for the question.
- Click Save.
Build a dashboard
Dashboards in Metabase let you combine multiple visualizations into a single view, track key metrics, and explore data interactively. Follow these steps to create a dashboard:- From the Metabase homepage, click New > Dashboard.
- In the Name field, enter a name for the dashboard.
- Click Create.
- Create a question.
- In the saved question page, click the three dots
...menu at the top right corner of the page. - Click Add to dashboard > New dashboard.
- In the Name field, enter a name for the dashboard.
- Click Create.
- Organize the layout: Drag and resize cards in a grid-style interface.
- Add dashboard filters: Enable cross-card filtering for cohesive exploration.
- Set a refresh schedule: Control when data updates, such as hourly or daily.
Best practices for optimizing performance
Metabase queries can become expensive, especially on large datasets or distributed engines like Trino. The following best practices help reduce execution time, lower load on the engine, and improve dashboard responsiveness.Avoid full table scans
Large unfiltered queries are costly. Always filter or limit data early when possible. Filtering drastically reduces the data scanned and speeds up execution.-
Bad example: Full table scan
-
Good example: Filter early
Use date filters
Filtering by a recent time window reduces the amount of data scanned. For examplePrefer aggregated queries
Aggregations reduce the amount of data processed and returned.-
Bad example: Returning raw rows
-
Good example: Summary metric
Use partitions
If you partition Iceberg tables, filtering on partitions, such as date or region, significantly improves performance.-
Bad example: Filtering on a non-partition column.
-
Good example: Filter using the partition column.
Limit returned data
Visualization queries should return summaries or KPIs, not raw tables with large row counts.-
Bad example: Returning millions of rows.
-
Good example: Return only needed fields, or aggregated data.