Core capabilities
Kyuubi supports several core capabilities, which include:- JDBC/ODBC access: By supporting the JDBC/ODBC universal database connectivity standards, Kyuubi allows a wide range of clients, such as Tableau, Power BI, DBeaver, and custom apps, to connect.
- Multi-tenancy: Kyuubi serves multiple tenants, which are logical groups of users within a Kyuubi instance. It also isolates sessions, resources, configurations, and data access by preventing one tenant’s workload from impacting another’s.
- Spark engines: Kyuubi is deeply integrated with Apache Spark. It can dynamically launch and manage Spark SQL engine instances on demand, for example, in YARN or Kubernetes, for each user or session, providing the full power of distributed Spark processing through simple SQL calls.
- SQL gateway: Kyuubi extends the Apache Spark Thrift JDBC/ODBC Server, which exposes a JDBC/ODBC interface over the Thrift protocol. This allows multiple clients to connect and run SQL queries without needing to know the details of the backend execution engine.
Supported SQL engines
Kyuubi supports two types of SQL engines, which include:- Spark SQL: This is the primary and most feature-complete engine supported by Kyuubi. It leverages Spark’s distributed computing power for complex ETL, batch processing, and SQL analytics.
- Optional engines such as Trino or Flink: Kyuubi’s architecture is pluggable. While Spark is the default, it extends and connects with other SQL engines like Trino for high-performance and low-latency querying or Apache Flink for real-time and stream processing. The availability of features depends on the backend engine used.
Architecture
The architecture of Kyuubi is client-server-based, meaning it’s designed to separate the client interface from the heavy-lift processing engines. This section describes how the components interact with each other.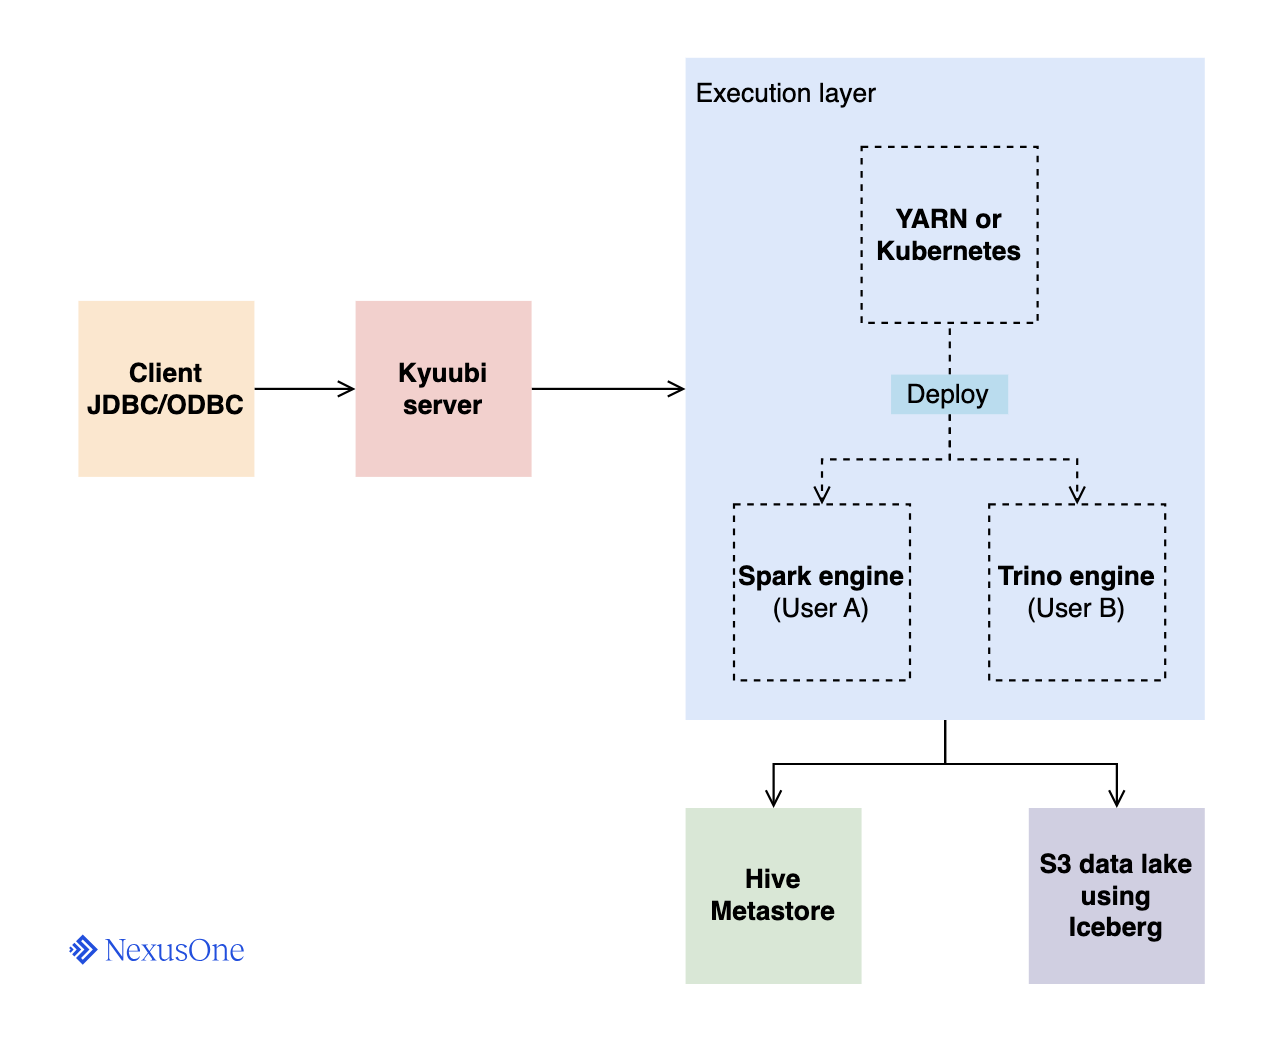
- Client: The app or user submitting SQL queries via a JDBC or ODBC interface.
- Kyuubi server: This is the central gateway node. It’s a stateless service that
clients connect to. Its responsibilities include the following:
- Authenticating clients
- Managing JDBC/ODBC sessions
- Parsing and routing client requests
- Managing the lifecycle of backend engines
- Execution layer: This comprises the orchestrator and the engine. When a client connects,
the Kyuubi server requests this layer to deploy an engine.
- YARN or Kubernetes: The app orchestrator. It deploys a YARN container or Kubernetes pod containing an engine.
- Engine: A worker process that executes the SQL queries. A few examples include:
- Spark engine: A long-lived Spark driver process deployed for query execution. Kyuubi can map client sessions one-to-one or allow multiple sessions to share the same engine.
- Trino Engine: A Trino coordinator node deployed for query execution. Same principles as Spark; sessions can share or have isolated engines.
- Hive Metastore: Kyuubi doesn’t store table metadata on its own. The Hive Metastore (HMS)
serves as the catalog for tables, by providing metadata such as schema, partitions, and locations.
This setup provides features such as:
- Time travel
- Schema evolution
- Partition evolution
- Efficient inserts/updates/upserts
- Atomic commits
- S3 data lake: The storage layer where data files reside. In NexusOne, Iceberg is the primary table format. The engines read or write data here based on metadata from the Hive Metastore.
Exploring the Kyuubi UI
The Kyuubi UI is a built-in web-based interface that provides real-time visibility into the server’s operations, active users, and running queries. It’s an essential tool for both administrators and developers for monitoring and debugging. Kyuubi is available at the following designated URL:When you purchase NexusOne, you receive a client name.
Replace
client with your assigned client name.Overview
This displays the main dashboard, which gives a high-level summary of the server uptime, version, and aggregate metrics such as the total sessions and executed statements.Management
This management page displays information about sessions, operations, Kyuubi engines, and Kyuubi servers.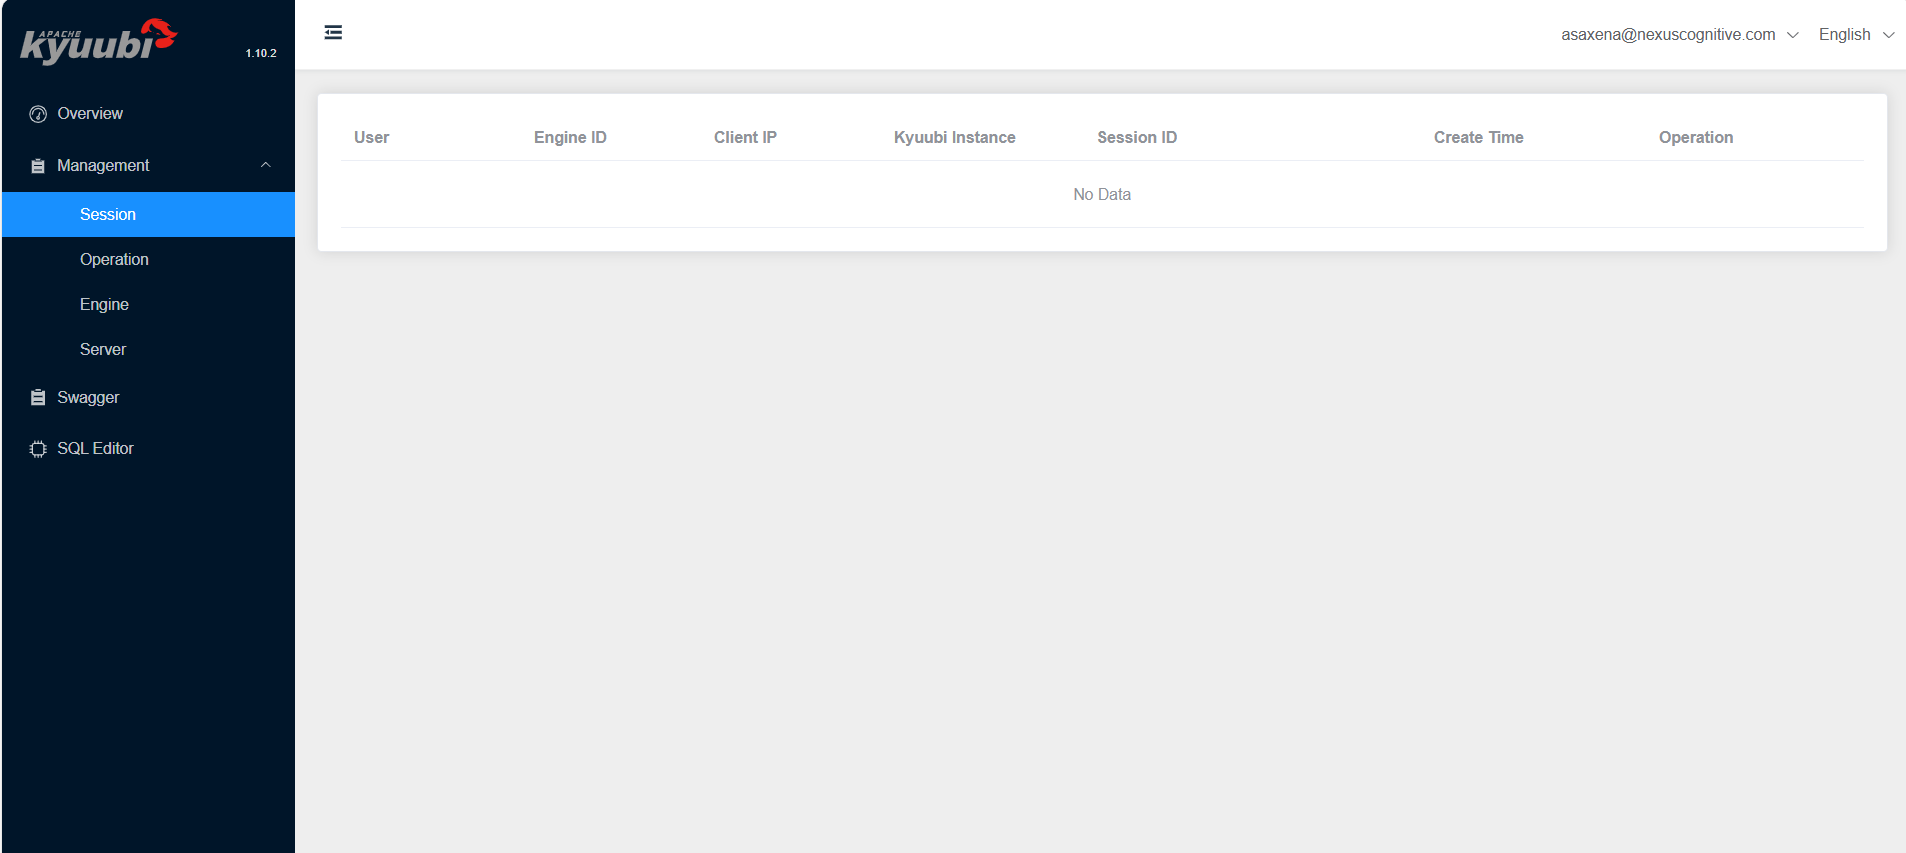
Management sidebar on the UI
- Session: The session page displays a table with the following details:
User: Name of the user who created the JDBC or ODBC sessionEngine ID: ID of the engine used by the userClient IP: IP address of the client that made a requestKyuubi Instance: FQDN and port of the Kyuubi server, which registered the sessionSession ID: ID of the session created by the userCreate Time: Session creation timeOperation: Actions available for that session via web UI
- Operations: The operation page displays a table with the following details:
User: Name of the user who started the operationOperation ID: ID of the operation requested by the userStatement: SQL of the statementState: Current state of the operationState Time: Amount of time the operation has spent in its current stateCompleted Time: End time of the operationDuration: The amount of time that the operation has been runningOperation: Actions available for that operation via web UI.
- Engines: The engine page displays a table with the following details:
Engine Address: IP address of the engine’s serverEngine ID: ID of the engineEngine Type: Type of engine. The current version of the web UI only showsSPARK-SQLenginesShare Level: Shows who can use this engineUser: Name of the user who created the engineVersion: Version of the Kyuubi server associated with this engineOperation: Actions available for that engine via web UI
- Server: The Server page displays a table with the following details:
Server IP: Kyuubi server’s IP addressnamespace: Namespace to which the server belongsKyuubi Instance: FQDN and port of the serverVersion: Version of the Kyuubi serverState: Current state of the server
Swagger
The Swagger page displays an interactive Kyuubi REST-API reference. It enables sending requests to Kyuubi using a web interface. To send a request, click the desired HTTP method, select Try it out, enter parameters if necessary, and then click Execute.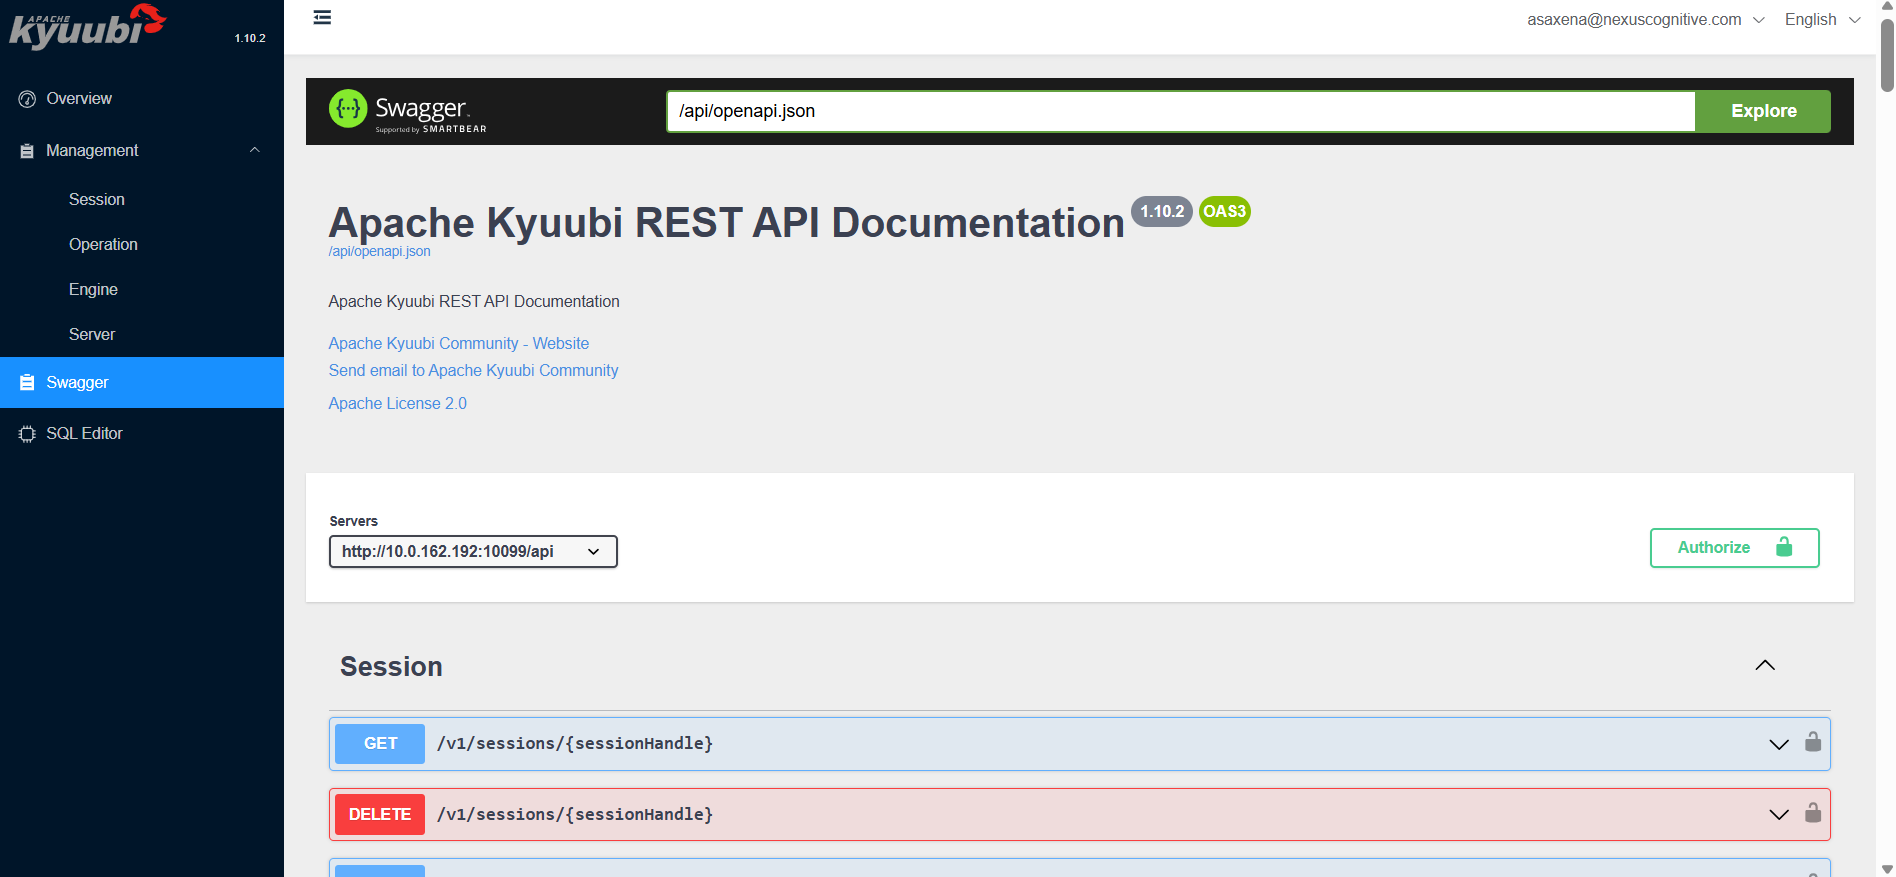
Swagger sidebar on the UI
SQL editor
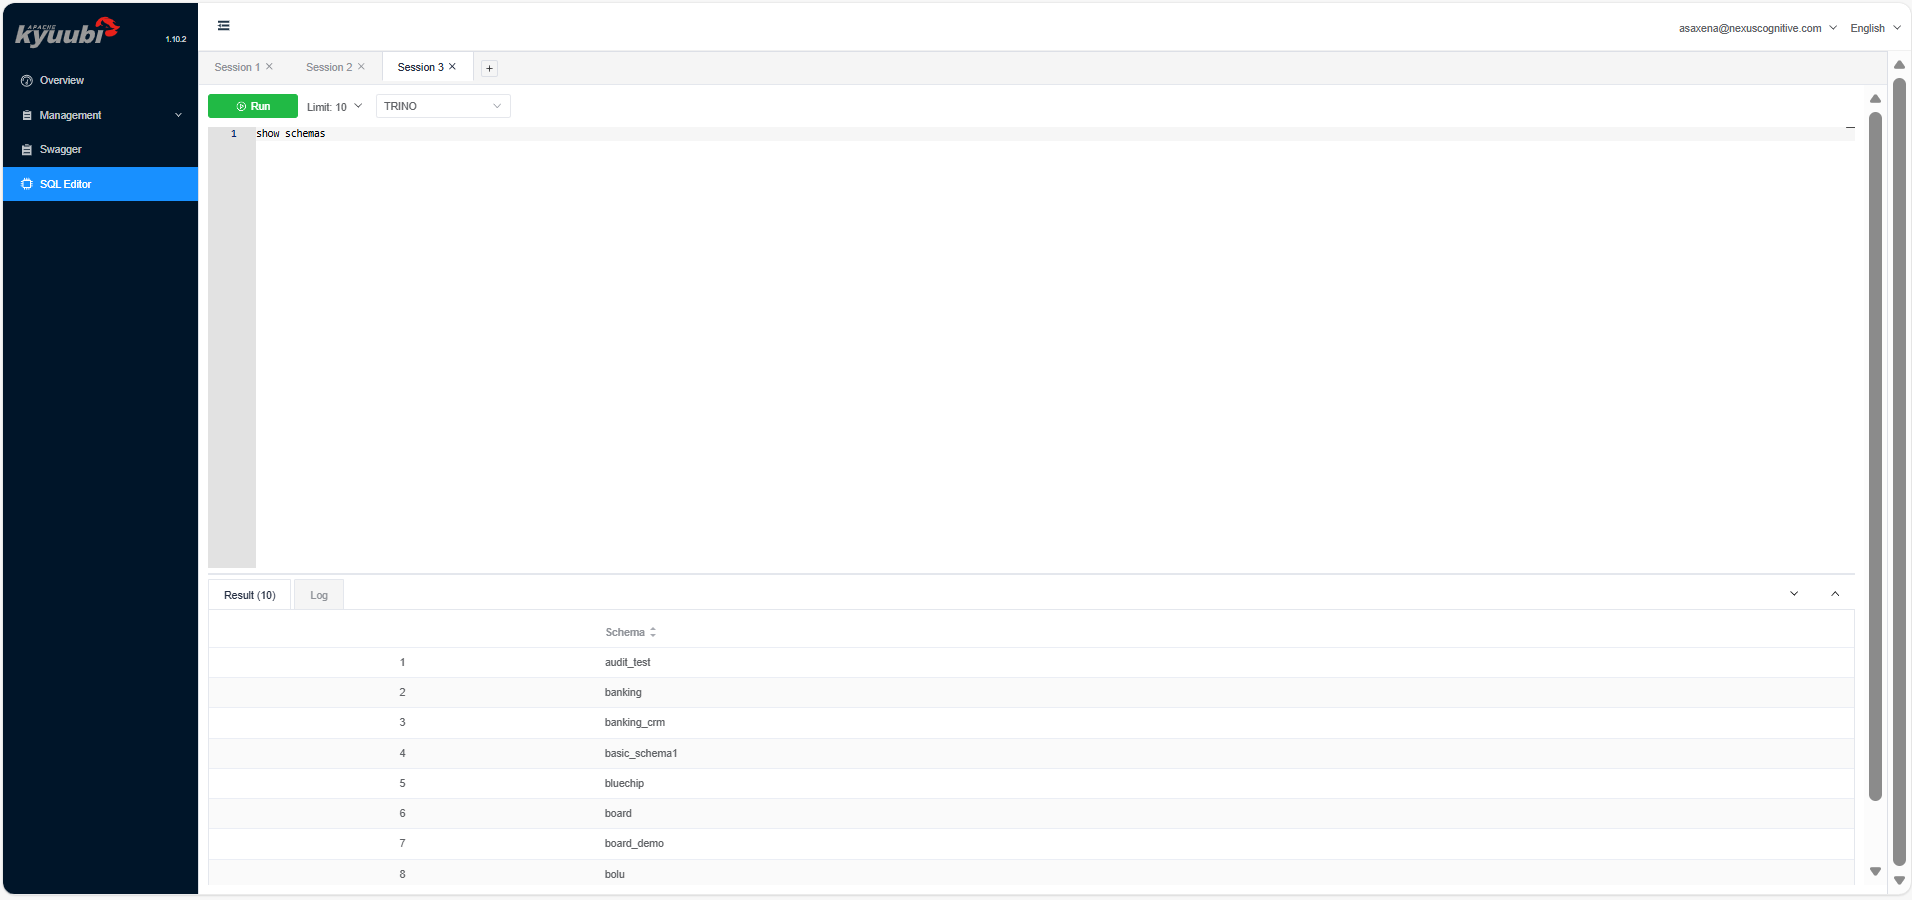
This SQL editor page displays an interactive interface where you can directly write, format, and execute SQL queries against the Kyuubi server. It’s a quick way to run queries without an external client and view logs. This sidebar page comprises the following when you run a query:- Result: A tabular format containing the result of a query.
- Log: Provides a history of executed SQL statements. You can see the query text, execution time, and status. Then you can crucially access the detailed logs and error messages for troubleshooting failed operations.
Kyuubi hands-on examples
This section describes several hands-on examples of using Kyuubi.Running SQL
Kyuubi provides multiple pathways to execute SQL. You can either use the Kyuubi UI or JDBC.Run SQL using the Kyuubi UI
Use the following steps to run SQL using the Kyuubi UI:- From the Kyuubi UI homepage, click SQL Editor.
- Type
show schemasand click Run. It displays a result in a tabular format below the editor.
SQL editor sidebar on the UI
Run SQL using JDBC
This is the standard method for programmatic and tool-based access. You use a JDBC connection string to connect from tools, such as Beeline, DBeaver, SQuirreL SQL, or your own Java/Scala app. The following example describes how to connect from Beeline:- Navigate to JupyterHub
-
Use either of the following to open the terminal:
- From the Launcher tab, click Terminal.
- Click + on the left sidebar to open the Launcher tab, and then click Terminal.
-
Enter the following command:
-
After successfully connecting, enter the following command:
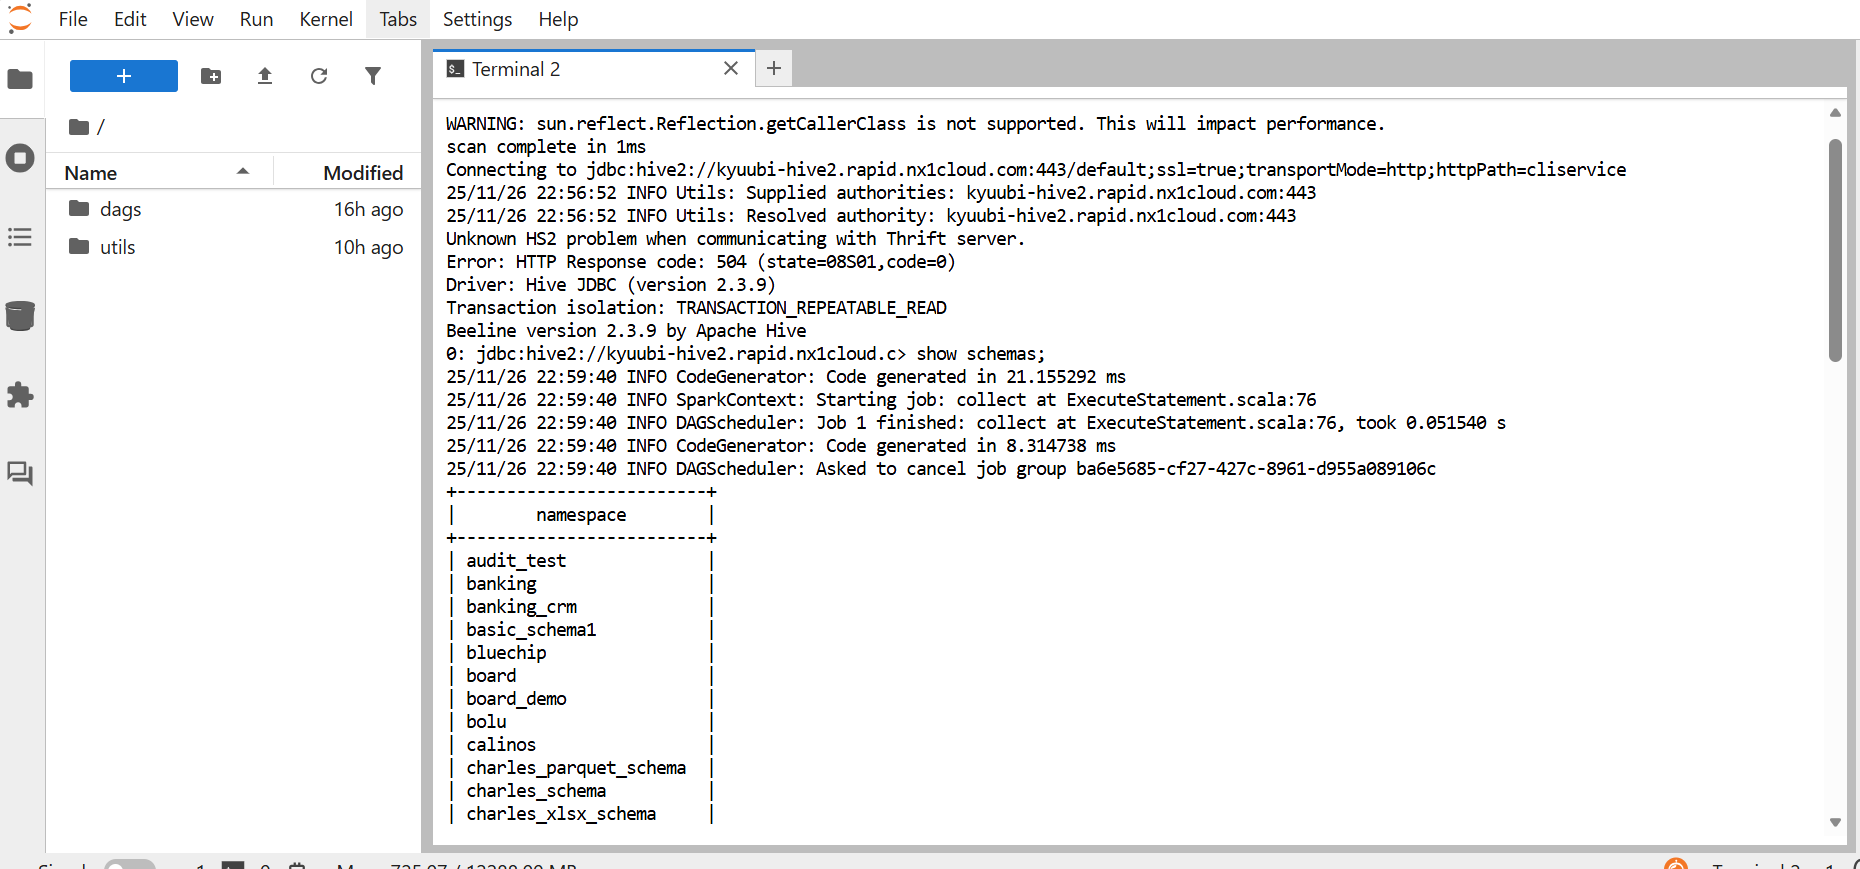
A SQL command in JupyterHub using a JDBC connection from Beeline
Run SQL using a Trino client
You can use a Trino command-line tool to run SQL queries through the Trino engine. This provides fast, interactive querying on the same datasets managed through Kyuubi. Trino or Java are two types of Trino command-line tools you can use.-
Trino command-line tool: This is available through Homebrew, apt/yum, or as a standalone
executable. It provides a wrapper script that already knows how to start the command-line tool,
which then makes the command short and simple. You can authenticate using the following command,
and then run your SQL command.
-
Java command-line tool: This is available when you manually download the command-line tool JAR
and don’t have the wrapper installed. In that case, before running your SQL command, you must
launch the command-line tool directly with Java and authenticate using the following command.
 A Java command-line tool initiates an SSO login session to a specified catalog and schema. Then a SQL command runs.
Other ways to run SQL
There are several other ways to run SQL using Kyuubi:- Python using PyHive or JayDeBeApi: You can connect to Kyuubi using the PyHive or JayDeBeApi libraries that speak the HiveServer2 protocol. This allows you to run SQL from Python scripts or notebooks for data engineering and science workflows.
- BI tools: Major BI tools like Tableau, Power BI, and Superset can connect to Kyuubi using its ODBC or JDBC driver. This allows you to build dashboards and reports on top of your data lake.
Table operations
Kyuubi lets you run all kinds of SQL commands, including Data Definition Language (DDL) and Data Manipulation Language (DML). What actually works depends on the engine and table format you’re using. Key examples include:-
Create, insert, and read tables: You can use standard SQL syntax:
CREATE TABLE: Defines a new table in the catalogINSERT INTO: Appends data into an existing tableSELECT: Reads data from tables
-
Create Table As Select (CTAS) queries: A powerful and efficient operation to create a new
table populated with the results of a SELECT statement. It combines DDL and DML in a single, atomic operation.
For example,
CREATE TABLE high_pay_employees AS SELECT * FROM employees WHERE salary > 100000; -
UPDATE,DELETE, andMERGEavailability: Support for these upsert commands varies.- Spark SQL with Hive tables: Traditionally, Hive tables are append-only.
UPDATEandDELETEare only possible on tables that support ACID transactions. - Spark SQL/Trino with Iceberg tables: This is where modern table formats shine. Apache
Iceberg fully supports row-level
UPDATE,DELETE, andMERGEoperations. These make implementing Change-Data-Capture (CDC) and complying with General Data Protection Regulation (GDPR)right to be forgottenmuch easier. This means you can delete specific user data without rewriting entire tables.
- Spark SQL with Hive tables: Traditionally, Hive tables are append-only.
-
Table-format-specific behaviors with Iceberg: When working with Iceberg tables through Kyuubi
with a supporting engine, you gain access to Iceberg-specific features, such as the following:
-
Time travel: Query data as it existed at a specific point in time or snapshot version using
SELECT ... FOR TIME AS OF <timestamp>orSELECT ... FOR VERSION AS OF <version>. -
Hidden partitioning: You can derive a new column from an existing one to organize data
into partitions, without storing the new column in the table.
For example, use a Create Table As Select (CTAS) query to create a new table and populate
it with the results of a SELECT statement in a single step.
-
Time travel: Query data as it existed at a specific point in time or snapshot version using
Logging and monitoring
Effective logging and monitoring are crucial for operating and debugging a distributed system like Kyuubi. It provides multiple layers of observability, which include the following:-
Query logs: These are high-level logs that focus on individual SQL statements. They show
the execution plan, progress, and any errors encountered during the query’s runtime. Key details include:
- Primary location: On the Kyuubi UI, specifically, after executing a query in the SQL Editor tab
-
Content: Includes the SQL text, start/end time, status, and the full output from the engine
 Sample log outputs from a query
- Engine logs: These are logs associated with the engine instance, such as the Spark driver process. They’re more general than query logs and contain information about the engine’s lifecycle, configuration, and any errors that occur outside a specific query. You can find the engine logs in the Kyuubi UI under the “Engines” tab. Each running engine has a link to its logs.
Tools for debugging
You can use the Spark UI and History Server to get a deeper look into your Kyuubi engine’s performance:- Spark UI: For actively running Spark engines, the Kyuubi UI provides a direct link to the associated Spark Application UI. This UI shows detailed DAGs, task execution times, garbage collection metrics, and data skew information.
- Spark History Server: Once an engine terminates, you can check its full execution history in the Spark History Server by using the app ID from the engine logs. This lets you trace what happened and pinpoint performance issues more effectively.
Typical debugging workflow
When a query fails or runs slowly, you can use the following debugging workflow to track down the issue:- Start in the Kyuubi UI when a user reports a failed query.
- Check query logs by navigating to the Engines tab. Find the failed query, and click Logs.
The error message here might be
Table not found, Permission denied, which then points you in the right debugging direction. - If the error is unclear, check the engine logs for the session to look for broader issues such as a classpath conflict or engine disconnection.
- For performance issues, when the query is slow, click the link to the Spark UI. Examine the job’s DAG visualization and task metrics to identify stages with long-running tasks, data skew, or excessive shuffling.
Security
Kyuubi operates in a secure enterprise environment by integrating with standard authentication and authorization systems, to ensure that you can control and audit data access. The following list describes how Kyuubi enforces security:- Authentication mechanisms: This is the process of verifying your identity. Kyuubi can use OAuth 2.0, specifically, the OAuth 2.0 protocol using JSON Web Token (JWT) tokens. In this mode, you don’t use a username or password, instead, you use a bearer token obtained from a central identity provider such as Okta, Auth0, or Kerberos. The Kyuubi server validates this token before allowing a connection.
-
Authorization via external tools: This is the process of determining what an authenticated
user has permission to do. Kyuubi typically delegates authorization to external systems. Apache Ranger
is a common choice, and this is what’s used in NexusOne. Ranger allows administrators to define
fine-grained policies, for example,
User alice can SELECT on the sales_db database. When a user submits a query likeSELECT * FROM sales_db.sales_data, Kyuubi passes the query to the Ranger plugin, which checks the policy and returns a permit or deny decision. -
Engine/Session isolation: This is a critical security and multi-tenancy feature.
When a user authenticates, Kyuubi can launch an engine, such as a Spark driver, for that user.
This engine runs under the user’s own OS-level identity, for example, via a Kerberos keytab
or proxy user impersonation. This provides the following:
- Data access: The engine can only access HDFS files or S3 objects that the user themselves has permission to access.
- Resource isolation: There is resource (CPU, memory) isolation of one user’s engine from another’s.
- Fault containment: A misbehaving or crashing engine from one user doesn’t affect the sessions of other users.
Kyuubi REST APIs
Beyond JDBC/ODBC, Kyuubi exposes a REST API for programmatic management and integration. It allows you to manage sessions, submit queries, and monitor apps programmatically, which is ideal for scripts, CI/CD pipelines, or custom administrator dashboards. The following list describes how the REST API works:-
Available endpoints: Kyuubi offers the following endpoints:
GET /v1/sessions: Retrieves a list of all active sessions on the server, with details like user, client IP, and creation time.GET /applications: Lists the engine apps managed by Kyuubi.POST /api/v1/applications: Allows for submitting a Spark app directly via REST. This is an alternative to using thespark-submitcommand.POST /api/v1/sessions/{sessionId}/operations: Submits a SQL statement within a specified session. You first create a session via the API and then submit operations to it.
-
Authentication and headers: Access to the REST API is typically secured.
- Mechanism: Often uses Basic Auth or an HTTP Bearer Token authentication, which is the same OAuth 2.0 JWT token used for JDBC.
- Headers: Every request includes an
Authorization: Bearer <your-jwt-token>header.
-
Common request/response format: All requests and responses use the JSON format, which
makes it easy to parse in any programming language.
- Request: A query submission body looks like
{"statement": "SHOW DATABASES"}. - Response: A successful response includes fields such as
operationId,status, and aresultSetwhen the query returns data.
- Request: A query submission body looks like
-
Error handling: The API uses standard HTTP status codes.
200 OK: Success400 Bad Request: Malformed request, such as an invalid JSON401 Unauthorized: Missing or invalid authentication token500 Internal Server Error: Server-side failure during processing
Kyuubi-submit for Spark jobs
Kyuubi-submit is a Python-based command-line interface wrapper tool designed to simplify the submission and monitoring of Spark jobs through Kyuubi. It allows you to run Spark SQL queries from outside the Kubernetes cluster. The Kyuubi-submit tool performs the following:- Simplifies job submission by providing an intuitive command-line interface
- Automates monitoring with real-time status updates and progress tracking
- Provides comprehensive logging with automatic log retrieval
- Supports configuration management through YAML files for reusable job templates
- Integrates seamlessly with Spark History Server and YuniKorn queue management
- You enter an input through the command-line tool or a YAML file.
- Kyuubi-submit merges that input with its configuration.
- The request goes to the Kyuubi REST API.
- Kyuubi submits the job to Spark on Kubernetes.
- You monitor the run and review the logs.
Basic Spark job submission
The following code describes a basic Spark Job submission:- Kyuubi authenticates with the server using the provided credentials.
- Kyuubi-submit constructs the batch configuration with deploy mode set to “cluster.”
- Kyuubi submits the job via the REST API to
/api/v1/batches. - Kyuubi-submit starts a monitoring loop to show real-time status.
- After completion, it retrieves and displays all app logs.
- Kyuubi-submit provides the Spark History server URL for detailed debugging.
PySpark job with dependencies
The following code submits a PySpark ETL job with dependencies:- No
-classnameneeded for PySpark. It usesorg.apache.spark.deploy.PythonRunnerautomatically. - Python dependencies listed in
--pyfilesare automatically distributed to the cluster. - Kyuubi applies the YuniKorn queue configuration automatically to schedule your job.
- Adaptive query execution enabled for better performance.
Production configuration with YAML
This example demonstrates how to run a production ETL job with Kyuubi-submit using a YAML configuration file. It includes the following steps:-
Create a file named
script.pywith the following code, then upload it to S3. -
Create a config YAML file named
dep.yamlwith the following code, ensure you replace the client, username, and bucket-name: -
Submit the job from your local terminal:
-
Configuration and authentication:
- Loads job settings from
dep.yaml - Prompts for password:
Password for user: ██████████ - Authenticates with the Kyuubi server
- Loads job settings from
-
Job submission:
- Submits Spark job to Kyuubi server
- Receives batch ID such as
batch_2024_01_15_08f3a2b1 - Displays:
Batch submitted successfully!
-
Kubernetes pod creation:
- Kyuubi triggers Spark driver pod creation in Kubernetes
- YuniKorn scheduler assigns pods to the
etl-jobsqueue - 50 provisioned executor pods based on configuration
-
Real-time monitoring: Kyuubi-submit displays the job state, app ID,
and Spark History Server URL in your terminal:
-
Spark execution:
- Spark driver runs main class:
com.company.risk.AnalysisEngine - Distributed processing across 50 executor pods
- Business logic executes with 16 GB memory per executor
- Spark driver runs main class:
-
Completion and cleanup: Once the job finishes, Kyuubi-submit shows the completion
status, archives logs to the Spark History Server, and automatically terminates all pods:
-
Log display if configured:
- Application logs appear in your terminal.
- Exit code
0indicates successful execution.