Environment configuration
This section describes how the NexusOne team configured Superset.Accessing the Superset UI
Superset provides a web-based interface to interact with it. You can access the Superset UI on NexusOne using the following URL:When you purchase NexusOne, you receive a client name.
Replace
client with your assigned client name.Trino integration
Within NexusOne, Superset connects to Trino and treats each catalog connected to Trino as a database. Within each catalog, you can query schemas and tables in SQL Lab, or select them for chart creation. Since NexusOne configured an Iceberg and Hive catalog within its Trino environment, it appears automatically in Superset without additional setup.Authentication and authorization
Superset uses OAuth 2.0 for authentication. After navigating to the previously mentioned URL, you must enter the credentials assigned to you when you purchased NexusOne to be successfully authenticated. For authorization, Superset controls user access to perform specific actions using role-based permissions in KeyCloak.Backend database
Within NexusOne, Superset uses a PostgreSQL database to store metadata about dashboards and charts. NexusOne ensures that a dedicated Superset database is available and that Superset can connect to it using the appropriate host, user, and password settings. This provides a reliable and persistent backend for all Superset metadata.Superset UI and SQL Lab
Superset provides an intuitive interface for both technical and non-technical users to explore data, write SQL, and build visualizations. Two major components of the user experience are SQL Lab and the Superset UI. Together, they enable query development, dataset preparation, and dashboard creation directly from a web browser.Superset UI overview
The Superset UI makes navigation and analytics simple. You can move between dashboards, datasets, SQL Lab, and chart creation through a clear layout.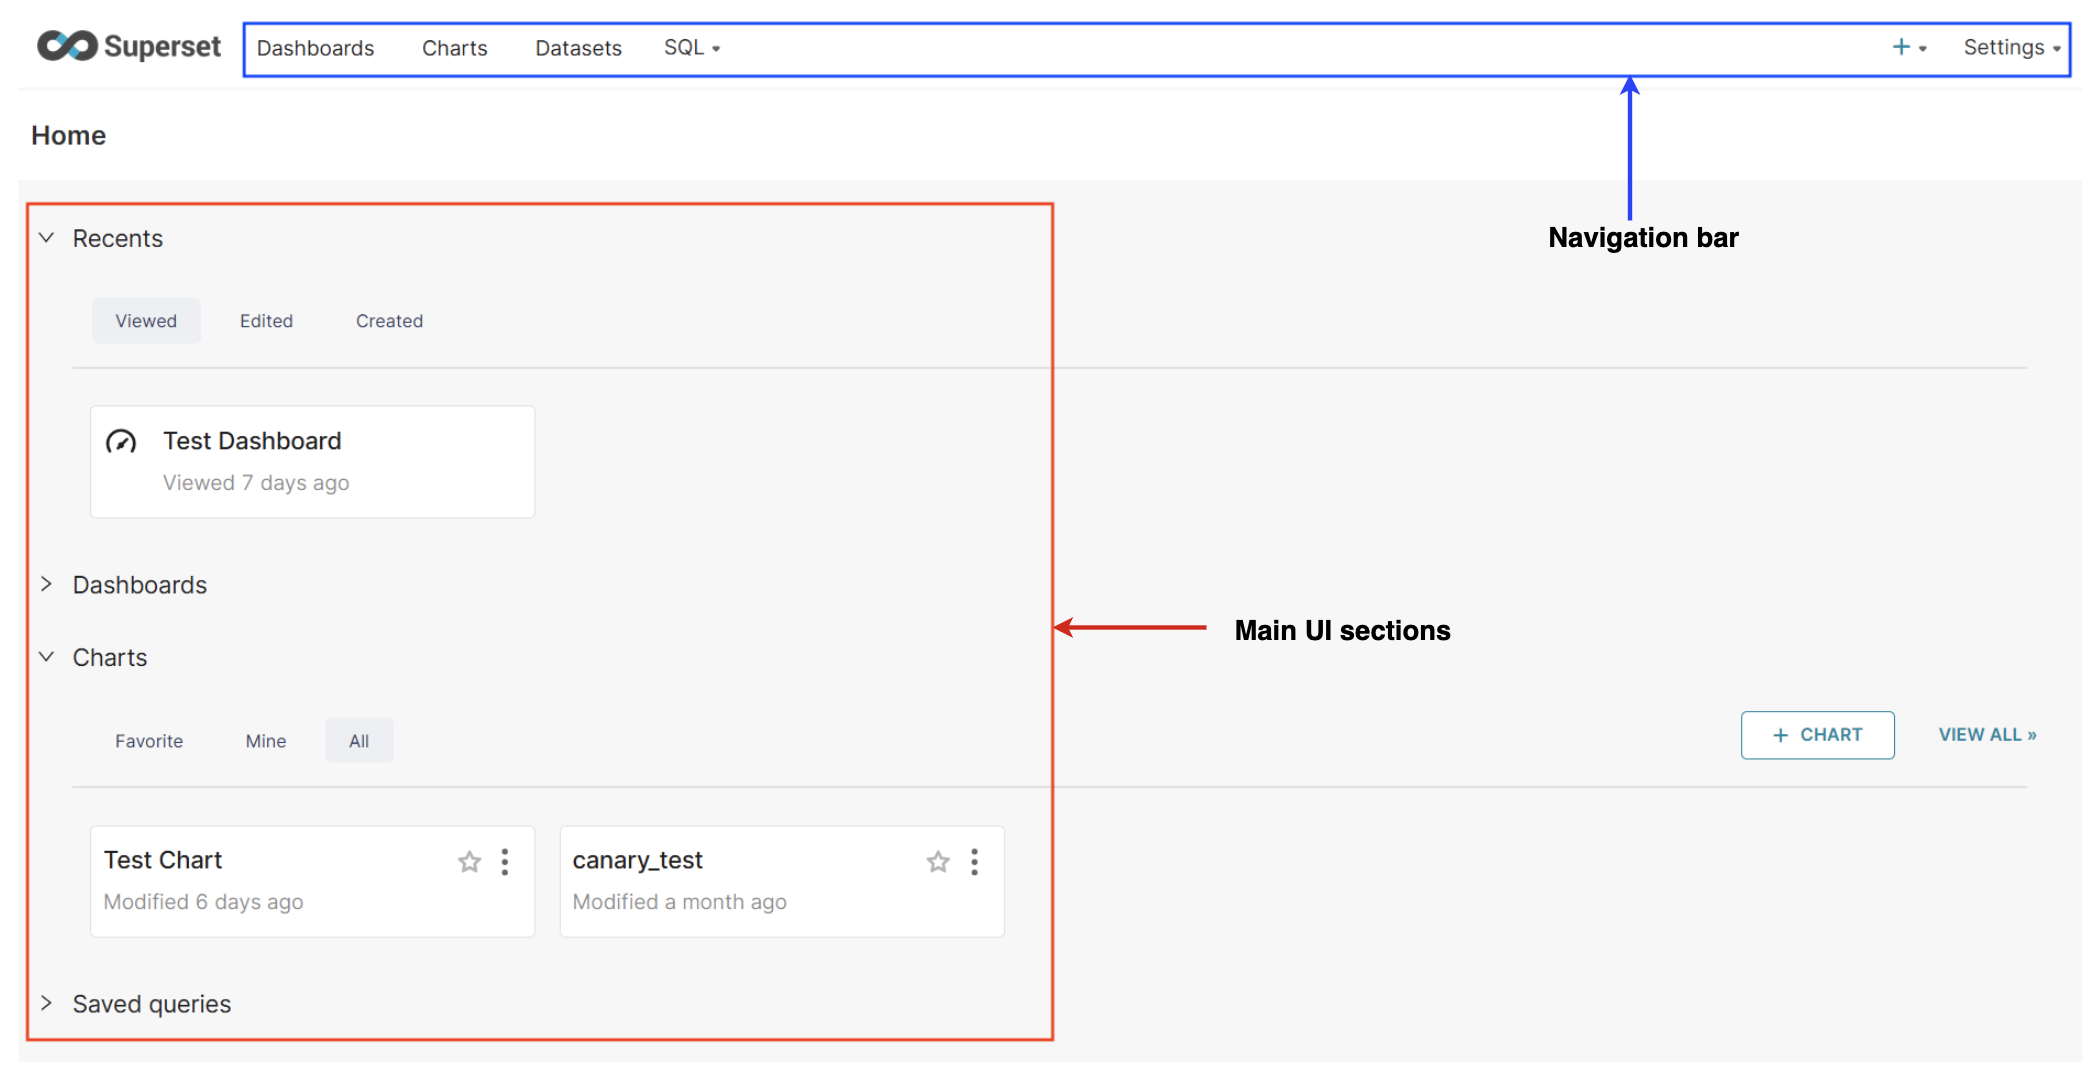
Superset homepage
Navigation bar
At the top of the Superset UI, the navigation bar provides quick access to all major features, such as:Dashboards: Lists all dashboards available to you and allows you to manage them.Charts: Lists all saved charts and allows you to manage them.Datasets: Lists all available datasets created from SQL Lab or imported from catalogs in Trino. Charts and dashboards use these datasets as sources.SQL: A dropdown menu that includes:SQL Lab: An SQL editor used to write and execute queries.Saved Queries: Previously stored SQL statements for reuse.Query History: Logs of past executed queries for reference or re-execution.
+: A quick-access button for creating new charts, dashboards, or datasets, depending on your configuration.Settings: User account options, including profile information, theme preferences, and language settings.
Main UI sections
The center page of the Superset UI provides summarized access to Superset features, such as:Recents: Displays items you have interacted with recently. It includes the following three tabs:Viewed: Recently viewed dashboards or chartsEdited: Items recently modifiedCreated: Items recently created
DashboardsandCharts: It includes the following three tabs:Favorite: Dashboards or charts marked as favoritesMine: Dashboards or charts created by the userAll: All visible dashboards or charts. You can also create a new chart or dashboard using the + Dashboard or + Chart option.
Saved Queries: Contains SQL queries you previously saved from SQL Lab. You can also create a new SQL query using the + SQL query option.
SQL Lab overview
SQL Lab is Superset’s built-in SQL editor, designed for interactive data exploration. It allows you to run queries against catalogs in Trino, preview results, and transform them into reusable datasets. To access SQL Lab, use the following steps:- At the top-left navigation bar of the Superset UI page, click the SQL menu.
- From the dropdown, select SQL Lab.
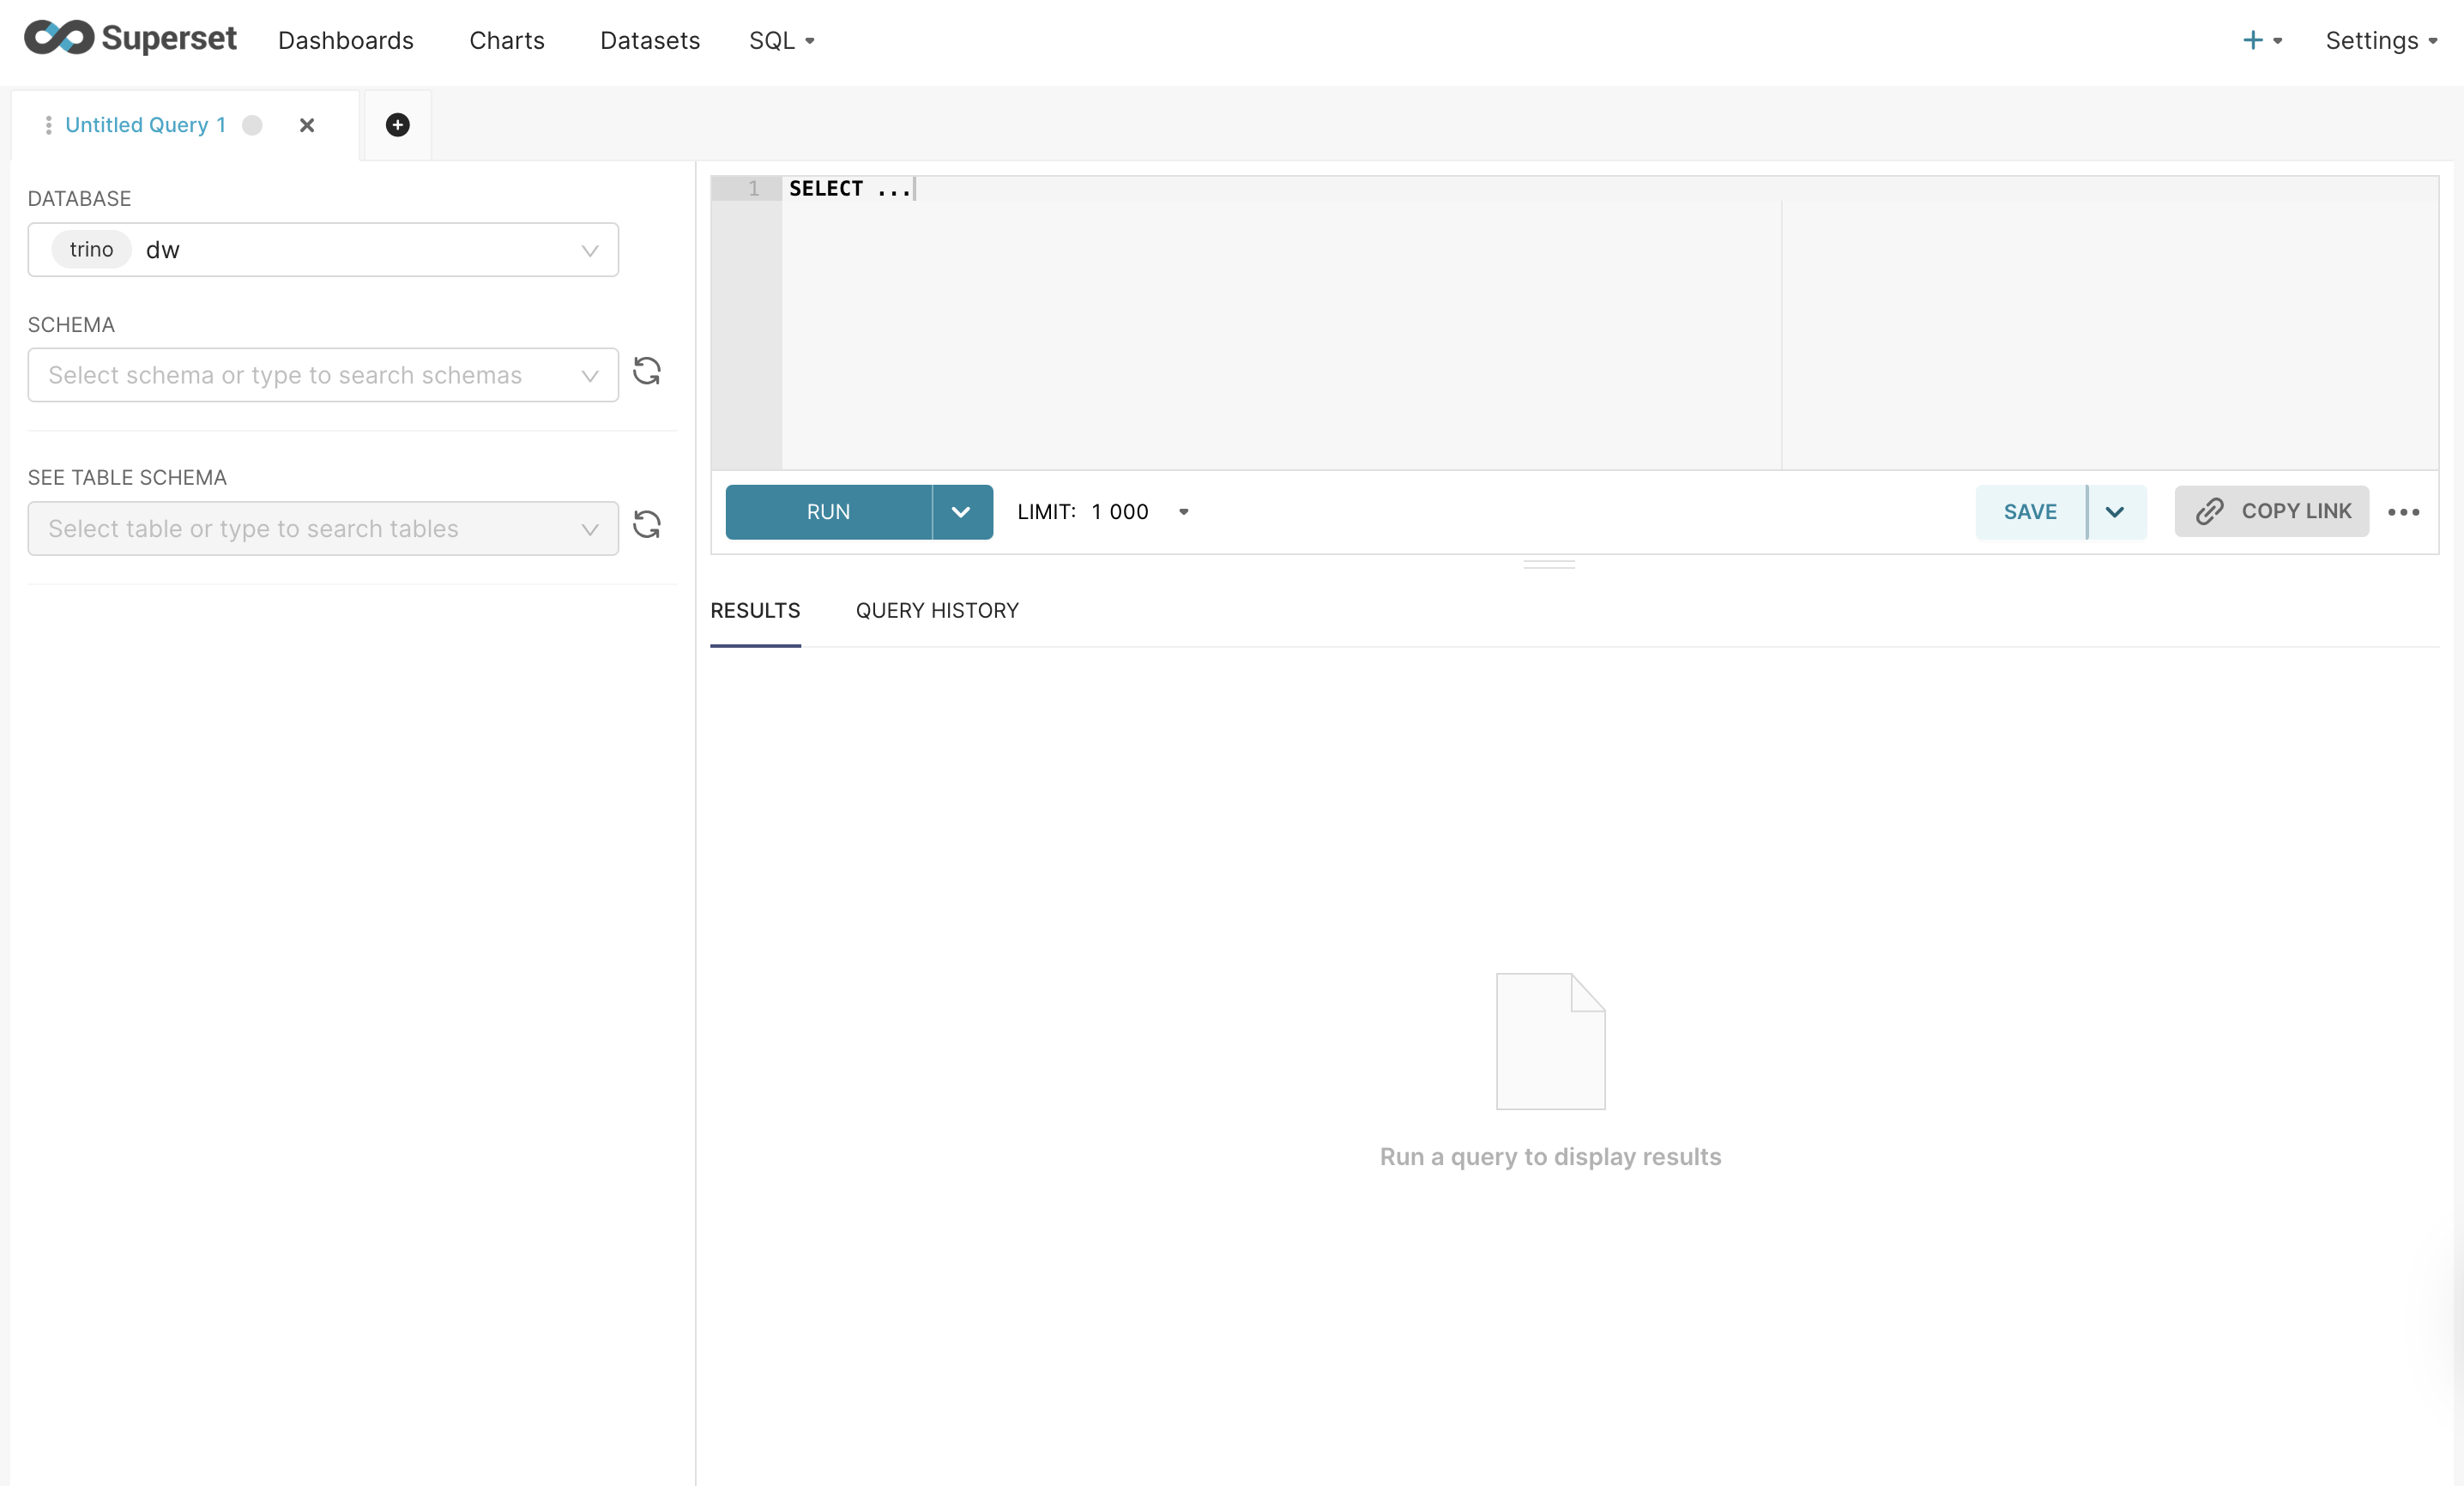
SQL Lab in Superset
Key capabilities
- Multi-catalog access via Trino: Each catalog in Trino appears as a database in SQL Lab. This allows you to query Iceberg, Hive, or other sources without additional configuration.
- Autocomplete and schema browser: SQL Lab provides interactive schema exploration. You browse catalogs, schemas, and tables before writing queries.
- Result previews: Query results appear instantly in a preview grid, allowing quick inspection before saving.
- Save queries and create datasets: You can do the following:
- Save a query for future reuse
- Convert SQL output into a named dataset for use in charts
- Async execution and task offloading: Within NexusOne, Redis and other configured Celery workers handle background execution. This enables long-running queries.
Additional resources
- To learn practical ways to use Superset in the NexusOne environment, refer to the Superset hands-on examples page.
- For more details about Superset, refer to the Superset official documentation.
- To learn more about how NexusOne uses KeyCloak and Trino, refer to the NexusOne KeyCloak and Trino documentation.