Run a query
Generally, when using SQL Lab to run a query, you take the following steps:- Select a catalog, schema, and table.
- Enter a query and run it. Superset displays all available tables.
- Selects unique employee IDs and first names
- Orders the results by employee ID in ascending order
- Limits the results to 50 rows
-
On Superset, this query would generate a table preview.
 SQL Lab query example
 -
If you’d rather create a table or view, you can click the dropdown menu beside
Run. It provides an option to create a table or view.
 Create a table or view
 -
After running the query, the results appear in a table format.
 Query result
 -
You can also view a history of when you ran these queries.
 Query history
Create a dashboard
You can create charts and dashboards in Superset to explore and visualize your data. Follow these steps to create a line chart and dashboard:- From the Superset navigation bar, click Charts and select + Chart to create a new chart.
- Choose the dataset you want to visualize.
- Choose a chart type, for example,
Line Chart, and click Create New Chart. - Configure the chart:
- Set the X-axis.
- Set the Metrics.
- Optional: Add filters or groupings as needed.
- Click Create Chart to preview the chart.
- Click Save, enter a chart name, select or create a dashboard, and click Save & Go to Dashboard.
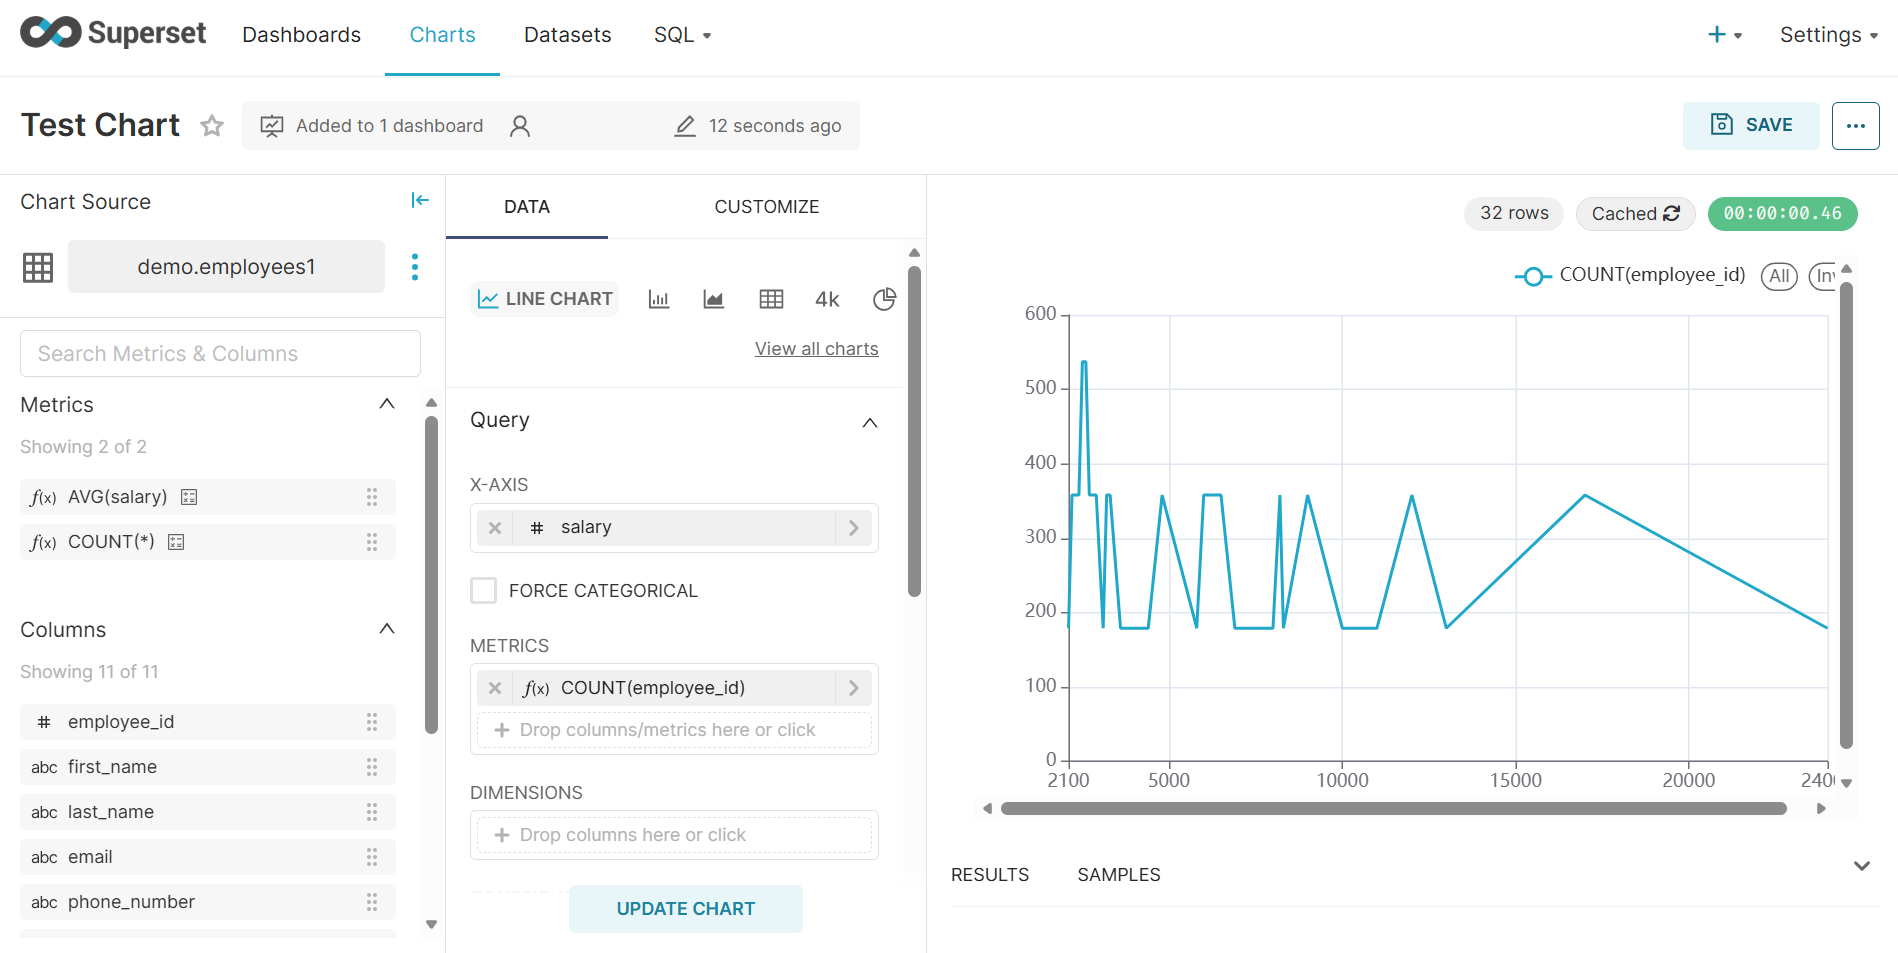
Creating a chart in Superset
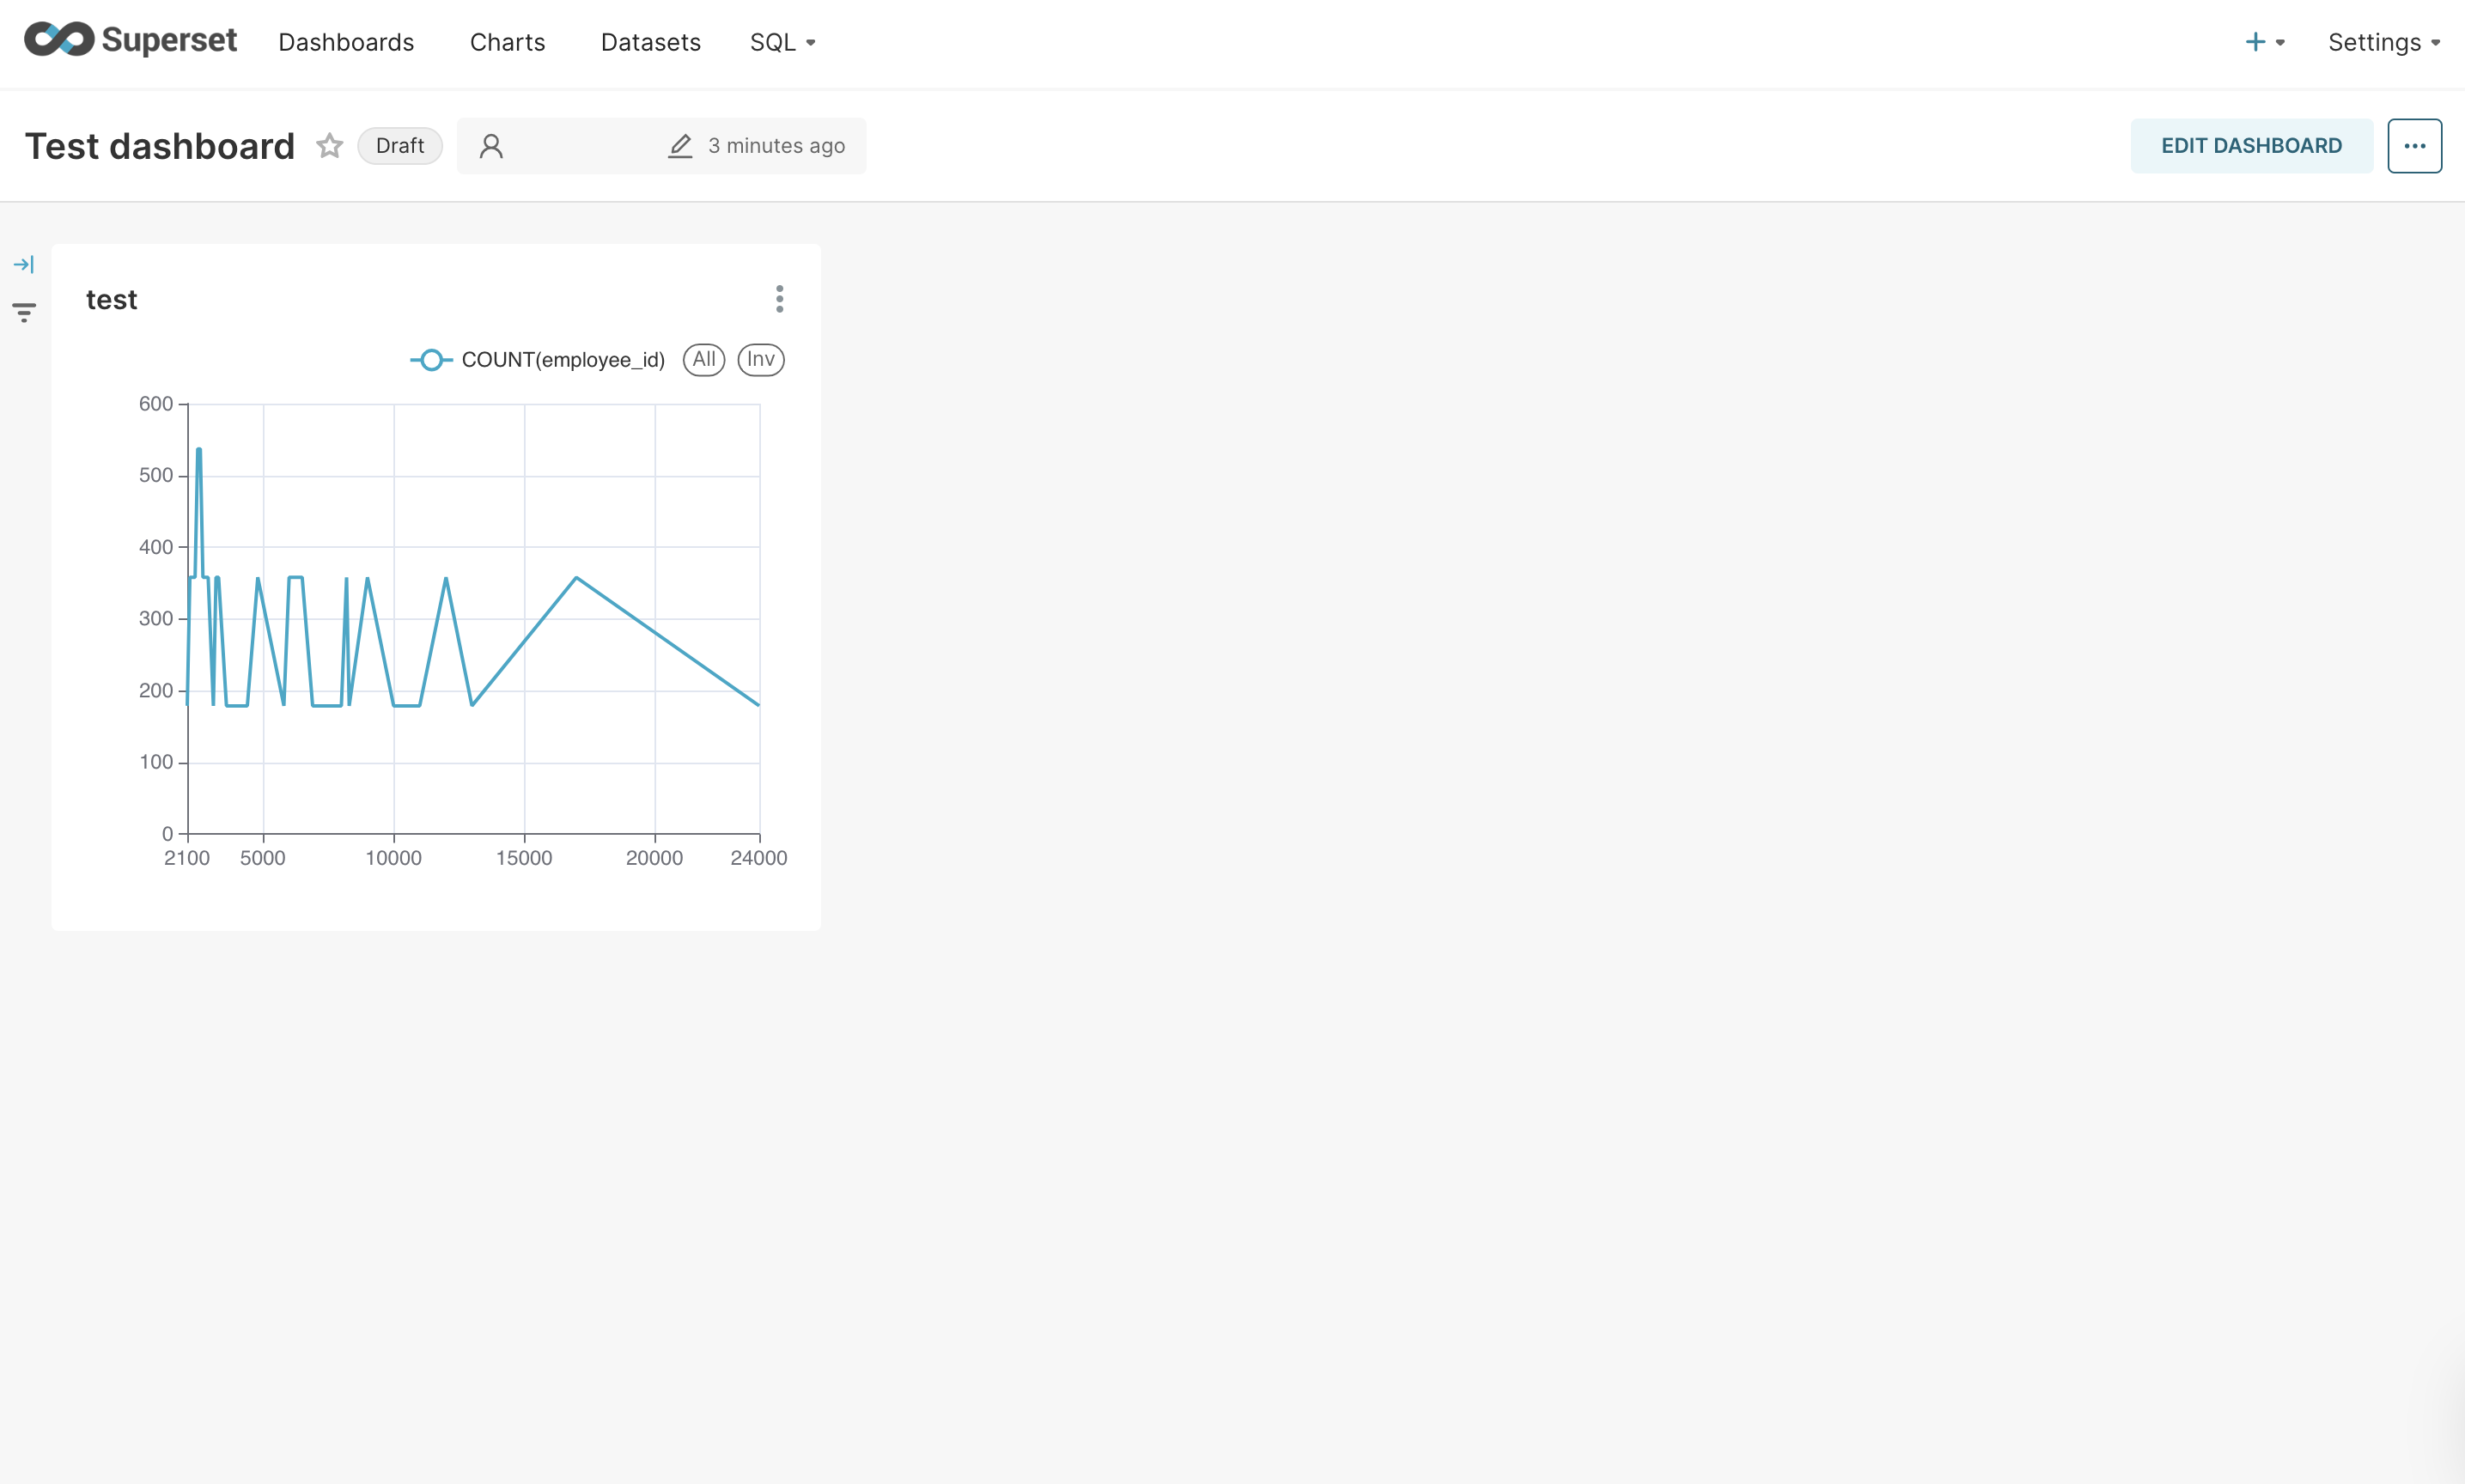
Dashboard created from the chart
Additional resources
- To get an overview of Superset, refer to the Superset in NexusOne page.
- For more details about Superset, refer to the Superset official documentation.
- To learn more about how NexusOne uses KeyCloak and Trino, refer to the NexusOne KeyCloak and Trino documentation.